How to Find the True Market Value of Your Dream Home
Reading time: 14 minutes
You’ve fallen in love with a house. The kitchen has that farmhouse sink you’ve always wanted, the backyard is perfect for summer evenings, and the neighborhood feels exactly right. But before you let emotion drive one of the biggest financial decisions of your life, there’s one critical question you need to answer: What is this home actually worth?
In 2026’s dynamic real estate market — shaped by post-pandemic recalibrations, interest rate shifts, and evolving buyer demographics — understanding true market value isn’t just helpful. It’s your most powerful negotiating weapon. Overpay by even 5%, and you could be underwater on your investment before you’ve unpacked a single box.
Well, here’s the straight talk: Market value isn’t a fixed number someone hands you — it’s a conclusion you arrive at through research, analysis, and strategic thinking. This guide will walk you through exactly how to do that, step by step.
Table of Contents
- What “True Market Value” Actually Means
- The Comparable Sales Method (CMA): Your Foundation
- Where to Find Reliable 2026 Market Data
- Beyond Comparables: Factors That Skew the Numbers
- Professional Appraisals vs. Online Estimators
- Market Value Influencers: A Data Snapshot
- Valuation Method Comparison Table
- Common Mistakes Buyers Make (and How to Avoid Them)
- Real-World Scenarios: Lessons from 2025–2026
- Frequently Asked Questions
- Your Home Valuation Action Plan
What “True Market Value” Actually Means
Here’s a concept most buyers gloss over: the asking price of a home and its market value are not the same thing. The listing price is what a seller hopes to receive. Market value is what a ready, willing, and informed buyer would actually pay under normal conditions — no distress, no artificial pressure, no inflated sentimentality.
The National Association of Realtors (NAR) defines fair market value as: “The price at which the property would change hands between a willing buyer and a willing seller, neither being under any compulsion to buy or sell, and both having reasonable knowledge of relevant facts.”
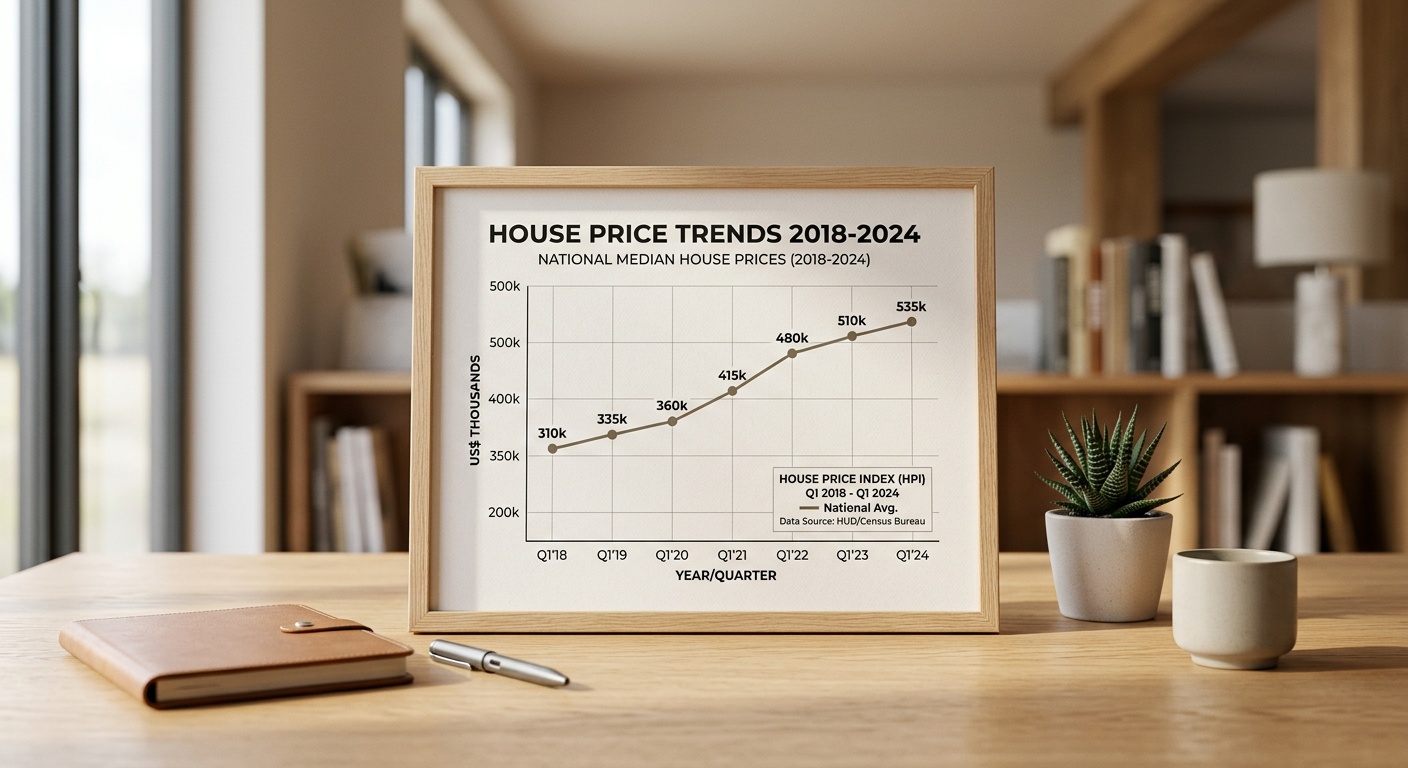
In practical terms, this means market value is determined by the market itself — the collective behavior of buyers and sellers in a specific geography at a specific point in time. As of Q1 2026, the U.S. median home price sits at approximately $412,000, according to data from the Federal Reserve Bank of St. Louis, but that number is almost meaningless without context. A home in Austin, Texas carries a completely different value calculus than a similar property in Cleveland, Ohio.
Why Buyers Consistently Misjudge Value
Cognitive biases are real, and they cost buyers real money. Anchoring bias — where your brain fixates on the first number you see (the listing price) — is the biggest offender. If a home is listed at $550,000, even savvy buyers subconsciously treat that figure as the “correct” baseline. In reality, that property might be worth $510,000 or $580,000 depending on market conditions.
Emotional attachment compounds the problem. Studies from behavioral economists at Duke University show that buyers who have toured a home three or more times are willing to pay an average of 8-12% more than buyers seeing it for the first time — simply due to psychological ownership effects. Knowing this bias exists is your first line of defense against it.
The Comparable Sales Method (CMA): Your Foundation
The Comparative Market Analysis — or CMA — is the backbone of real estate valuation. It’s the method used by listing agents, buyer’s agents, and appraisers alike. Mastering it puts you in the same analytical position as the professionals.
How to Build a CMA Step by Step
Step 1: Identify True Comparables (“Comps”)
A comp is a recently sold property that closely resembles your target home. To qualify as a reliable comp, a property should meet these criteria:
- Sold within the last 90 days (in fast markets, tighten to 60 days)
- Located within 0.5 to 1 mile of the subject property (adjust for rural areas)
- Similar square footage (within 15–20%)
- Same property type (single-family, condo, townhouse)
- Similar bedroom/bathroom count
- Comparable lot size and age
Step 2: Adjust for Differences
No two homes are identical. For every meaningful difference between your comp and the subject property, you apply a dollar adjustment. Real estate professionals use standardized adjustment values that vary by market, but here are typical 2026 benchmarks:
- Garage (1 car): +/- $8,000–$15,000
- Bathroom addition: +/- $10,000–$20,000
- Swimming pool: +/- $15,000–$40,000 (market-dependent)
- Finished basement (per sq ft): +/- $25–$50
- Updated kitchen: +/- $10,000–$30,000
Step 3: Calculate the Adjusted Price Per Square Foot
After adjustments, divide each comp’s adjusted sale price by its square footage. Average these figures across 3–5 comps, then multiply by your subject property’s square footage. This gives you a solid baseline value estimate.
Step 4: Weight Recent Sales More Heavily
A sale from 85 days ago carries less weight than one from 12 days ago, especially in a market shifting quickly due to interest rate movements. Apply a recency weighting — give 50% weight to sales under 30 days old, 30% to 30–60 days, and 20% to 60–90 days when averaging your comps.
Where to Find Reliable 2026 Market Data
Access to accurate data is non-negotiable. Here’s where to look:
- MLS (Multiple Listing Service): The gold standard. Your buyer’s agent can pull actual closed sale data — not just list prices. Ask specifically for “sold data” with days on market and final sale price vs. list price ratio.
- Zillow Research & Redfin Data Center: Both platforms publish regular market reports with median sale prices, price-to-list ratios, and inventory trends by metro area. In 2026, Redfin’s data center has expanded to include neighborhood-level absorption rate tracking.
- County Assessor Records: Public records showing actual sale prices. Free, unfiltered, and official. Most counties now offer online portals updated within 30 days of a sale closing.
- FHFA House Price Index: The Federal Housing Finance Agency releases quarterly reports showing appreciation rates by metropolitan statistical area — invaluable for understanding trajectory.
- CoreLogic Market Risk Indicators: A subscription-based tool used by professionals to assess overvaluation risk at the ZIP code level. Some lenders provide access to buyers.
Pro Tip: Cross-reference at least three data sources before drawing conclusions. Any single platform can have data gaps or algorithmic quirks that distort the picture.
Beyond Comparables: Factors That Skew the Numbers
Raw CMA data gives you a starting point. But real estate valuation is part science, part art. These qualitative factors can dramatically shift true market value in ways that comparable sales data alone won’t capture.
Hyperlocal Dynamics That Matter More Than You Think
School District Quality: According to a 2025 Brookings Institution study, homes in top-quartile school districts command a 17–25% premium over comparable homes in lower-ranked districts within the same city. This premium has actually widened since 2020 as remote work gave families more flexibility to prioritize schools.
Walkability and Transit Access: Walk Score data from 2025 shows that each 10-point increase in walkability translates to a $3,000–$5,000 increase in home value in mid-tier markets, and up to $15,000 in dense urban markets. With fuel costs remaining elevated in 2026, transit proximity has gained additional premium weight.
Micro-neighborhood Stigmas: Is the home on a corner lot with heavy traffic? Backing to a commercial property? Under a flight path? Directly adjacent to a rental complex? These “nuisance factors” rarely appear in comp adjustments but can suppress value by 5–15%. Conversely, backing to a greenbelt or park can add significant premium.
Interest Rate Environment: In 2026, with 30-year fixed mortgage rates fluctuating between 6.1% and 6.8%, affordability pressure has compressed buyer pools in higher price brackets. This means a home priced at $750,000 faces meaningfully fewer qualified buyers than it would have at 3.5% rates — which should theoretically suppress values in that tier. Always contextualize comps within the prevailing rate environment when they were sold.
HOA Health and Financial Reserves: For condos and HOA communities, the financial health of the association is a hidden value driver. An HOA with underfunded reserves or pending special assessments can subtract tens of thousands from effective value. Request the last two years of HOA meeting minutes and reserve fund study before making any valuation judgment.
Professional Appraisals vs. Online Estimators
Let’s settle an ongoing debate: Can you trust Zillow’s “Zestimate” or similar automated valuation models (AVMs)?
The honest answer is: sometimes, as a rough starting point. Zillow itself acknowledges a median error rate of approximately 2.4% for on-market homes and 6.9% for off-market homes as of 2025. In a $500,000 home, a 6.9% error equals $34,500 — more than enough to turn a good deal into a bad one.
AVMs struggle most with:
- Unique or custom homes with few true comparables
- Properties with significant deferred maintenance or recent renovations (they can’t see inside)
- Rural properties with irregular lot sizes
- Markets with low transaction volume (thin data = high error)
- Rapidly shifting markets (their models often lag 30–60 days behind reality)
A licensed appraiser, by contrast, performs an in-person inspection, applies professional judgment to adjustments, and produces a defensible valuation report. A standard appraisal costs $400–$700 in most U.S. markets in 2026 — cheap insurance for a $400,000+ purchase.
The strategic move: Use AVMs for initial screening, build your own CMA with agent-provided comp data, and commission an independent appraisal (separate from the lender’s required appraisal) for any property where you’re uncertain or where the stakes are highest.
Market Value Influencers: A Data Snapshot
The chart below illustrates the relative impact of key factors on residential property value based on aggregated research from NAR, CoreLogic, and urban economics studies (2025–2026 data):
Key Drivers of Home Value Variation (%)
*Represents share of surveyed appraisers citing each factor as “highly significant” in final valuations. Multiple factors apply simultaneously.
Valuation Method Comparison Table
| Valuation Method | Accuracy Level | Cost | Time Required | Best Used For |
|---|---|---|---|---|
| Automated Valuation (AVM) | Low–Moderate | Free | Instant | Initial screening |
| Agent CMA | Moderate–High | Free (agent service) | 1–3 days | Offer price decisions |
| Independent Appraisal | High | $400–$700 | 3–7 days | High-value or unique homes |
| Income Approach | High (for rentals) | Varies | 1–5 days | Investment properties |
| Cost Approach | Moderate | Part of appraisal | 3–7 days | New construction, unique properties |
Common Mistakes Buyers Make (and How to Avoid Them)
Even well-researched buyers stumble. Here are the three most costly errors — and the strategic fixes:
Mistake #1: Relying on Tax Assessed Value as a Proxy for Market Value
County tax assessments and market value are entirely different animals. Assessments are calculated using mass appraisal models updated annually (sometimes less frequently), often lag market reality by 12–18 months, and are explicitly not designed to reflect current transaction prices. In rapidly appreciating markets, assessed values can be 20–30% below true market value. In correcting markets, they can sit above it. Never use tax assessment as a valuation input — use it only for estimating property tax obligations.
Mistake #2: Ignoring Days on Market (DOM) as a Signal
Days on market is one of the most underused data points available to buyers. A property sitting at 90+ DOM in a market where the average is 18 days is telling you something — either it’s overpriced, has a material defect, or faces some market stigma. Conversely, a property that went under contract in 4 days in the same market suggests it was priced at or below market value and attracted competitive interest. Always ask your agent: “What’s the average DOM for comparable sold properties in this area, and how does this listing compare?”
Mistake #3: Failing to Account for Seller Concessions in Comp Prices
When a comp sold for $485,000, it looks clean. But what if the seller also paid $12,000 in buyer closing costs and threw in a $5,000 appliance credit? The “real” sale price, from a market value standpoint, was closer to $468,000. In 2025–2026’s market, seller concessions have become significantly more common as buyers face affordability pressure from elevated rates. CoreLogic data from late 2025 showed that 42% of transactions included some form of seller concession — compared to just 18% in 2022. Make sure your agent is pulling concession data from closed sales when building your CMA.
Real-World Scenarios: Lessons from 2025–2026
Scenario 1: The Overpriced Gem in Phoenix, AZ
In March 2025, a buyer named Marcus was looking at a 4-bedroom home listed at $598,000 in the Arcadia neighborhood of Phoenix. The home was beautifully staged and he’d toured it twice. His agent pulled 6 recent comps — four in the same subdivision and two on adjacent streets. After adjustments for the subject property’s smaller lot size and dated HVAC system, the adjusted comp average came to $562,000. Marcus offered $565,000. After two rounds of negotiation, he closed at $571,000. Without the CMA, he might have offered list price or higher. His data-driven approach saved him approximately $27,000 — enough to fund a kitchen renovation.
Scenario 2: The Undervalued Property in Columbus, OH
In contrast, consider Priya, a first-time buyer in Columbus in early 2026. She found a 3-bedroom ranch listed at $289,000 in a neighborhood near the Short North arts district. The listing had been on market only 3 days. Her agent’s CMA showed comps averaging $305,000 after adjustments — the home appeared underpriced. Priya moved quickly, offering $297,000 with an escalation clause up to $315,000. She won the home at $301,000, immediately gaining approximately $4,000–$12,000 in equity based on comparable values. Recognizing a below-market listing is just as valuable a skill as spotting an overpriced one.
Frequently Asked Questions
How often does market value change, and should I reassess before making an offer?
Market value is not static — it shifts with every new comparable sale, interest rate change, and inventory fluctuation. In active 2026 markets, meaningful shifts can occur in as little as 30–60 days. As a rule of thumb: if more than 45 days have passed since your agent pulled comps, request an updated analysis before submitting any offer. This is especially critical in markets showing month-over-month price movement of 1% or more.
Can I challenge an appraiser’s valuation if I think they’ve undervalued the property?
Yes — and this is more common than most buyers realize. If your lender’s appraiser comes in below the purchase price, you can submit a “reconsideration of value” (ROV) request. To succeed, you’ll need to provide specific comparable sales that the appraiser overlooked, factual errors in the report, or documented adjustments you believe were miscalculated. A successful ROV typically requires your agent’s active participation and should be submitted within 5–7 business days of receiving the appraisal report. In 2026, lenders are required under updated FHFA guidelines to provide a clear ROV process disclosure at loan origination.
Is the income approach relevant for a primary residence purchase?
The income approach — which values property based on its potential rental income — is primarily used for investment properties. However, it’s worth running a simplified version for any primary residence purchase, particularly if you might eventually convert the home to a rental or rent out a portion (like an ADU or basement suite). In 2026, with accessory dwelling unit (ADU) construction up 34% year-over-year nationally, many buyers are factoring potential rental income into their value calculus. If a home’s potential rental yield supports the purchase price independently, that’s an additional layer of financial validation.
Your Home Valuation Action Plan
Here’s the thing: every hour you invest in understanding true market value before making an offer is worth potentially thousands of dollars in your pocket. The buyers who win in 2026’s market — whether in competitive multiple-offer situations or patient negotiations on overpriced listings — are the ones who walk in with data, not just desire.
As AI-powered valuation tools improve and real estate transparency continues expanding through platforms like Redfin, Zillow, and county public records portals, the information advantage is increasingly available to every buyer. The question is who chooses to use it.
Here’s your immediate implementation checklist:
- ✅ Week 1: Pull Zestimate and Redfin estimate for your target home as a rough anchor — but treat these as directional only
- ✅ Week 1: Ask your buyer’s agent for a full CMA with 4–6 adjusted comps from the last 90 days
- ✅ Week 2: Research the local DOM average and the specific property’s listing history for price reductions
- ✅ Week 2: Investigate school ratings, walkability scores, HOA financials, and any nuisance factors affecting the specific lot
- ✅ Before Offer: Commission an independent appraisal if the property is unique, high-value, or if your CMA results feel uncertain
The broader trend is clear: as housing affordability remains a defining economic challenge through 2026 and beyond, buyers who treat real estate transactions with the analytical rigor of an investment decision — not just an emotional one — will be the ones who build lasting wealth through homeownership.
So ask yourself this: when you make an offer on your dream home, will you be guided by what you feel it’s worth — or by what the data proves it’s worth? The answer to that question could define your financial trajectory for the next decade.